Longitudinal boxplots: statistical summaries and visual conventions
Source:vignettes/articles/04-longitudinal-boxplot-statistics.Rmd
04-longitudinal-boxplot-statistics.RmdThe implemented figure summarizes one confirmed numeric analysis
variable across ordered visits, with a separate facet for each selected
treatment. Statistical calculations happen before rendering. The plot
draws those calculated values directly, so ggplot2 does not
choose a second quartile or whisker definition.
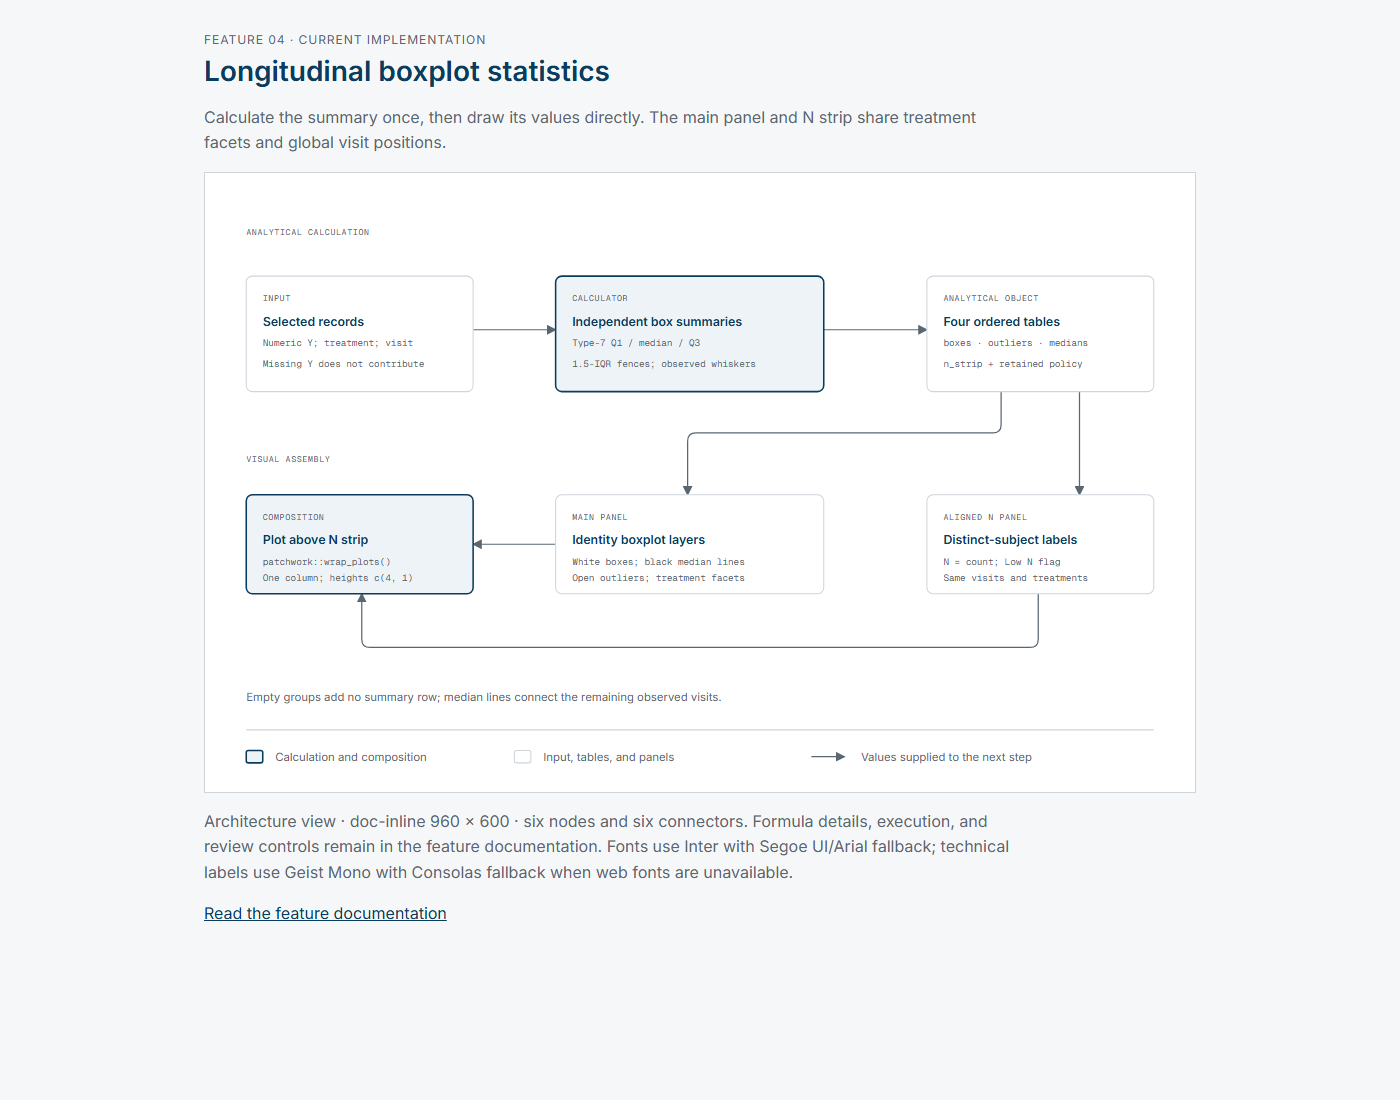
Selected records and grouping
calculate_boxplot_statistics()
consumes records from a validated selected-data profile, the treatment
and Y column names, ordered treatment and visit levels, and a retained
low-N policy. Required columns are USUBJID,
AVISIT, AVISITN, the selected treatment
column, and the selected numeric Y column. The supported workflow
selects stored AVAL, CHG, or
PCHG; this calculator does not derive change or percentage
change.
The calculator excludes missing Y values, missing treatments, missing
visits, and records outside the selected treatment and visit levels.
Selected non-finite values cause an error. It orders included records by
the supplied treatment order, visit order, and subject identifier, then
groups by treatment and visit. Supplied level order controls display
positions; AVISITN is retained in analytical rows. Upstream
profiling owns visit mappings and duplicate-key checks.
The Y distribution uses included records. The displayed N counts
distinct USUBJID values among those records, including
records classified as outliers. N therefore describes subjects
contributing non-missing selected Y values at that treatment and visit,
rather than the number uploaded or the number represented by the box’s
interior.
Exact statistical definitions
For sorted values x[1], ..., x[n], the type-7 quantile
at probability p uses h = (n - 1) * p + 1.
With j = floor(h) and g = h - j, the result is
x[j] + g * (x[j + 1] - x[j]); an integer position returns
x[j] directly. The calculator applies this definition at
0.25, 0.5, and 0.75 for the lower hinge, median, and upper hinge.
IQR = Q3 - Q1. The inclusive fences are
Q1 - 1.5 * IQR and Q3 + 1.5 * IQR. Whiskers
end at the smallest and largest observed values inside those fences,
rather than at the fence values. Values strictly outside are retained as
individual outlier rows, with subject identity, treatment, visit, and
value.
The expected-statistics
fixture makes small samples and edge cases explicit. For values
1, 2, 3, 20, Q1 is 1.75, the median is 2.5, Q3 is 7.25,
whiskers are 1 and 3, and 20 is an outlier. For
5, 5, 5, 5, 10, IQR is zero: both whiskers remain at 5 and
10 is an outlier. A single contributing value produces identical hinges,
median, and whiskers.
Low N is a flag, not a filter. It is true when distinct-subject N is
strictly below the retained policy value. validate_bds_profile()
supplies a default threshold of 5; a non-default policy retains its
value, rationale, authority, and version. Labels are
N = <count> or
N = <count> - Low N. Boxes remain visible when
flagged.
Empty groups and connected medians
The boxplot_analysis object retains four tables:
boxes, outliers, medians, and
n_strip, plus ordered levels, variable names, policy, and
analysis_version. An empty treatment-visit combination
creates no box, median, or N-strip row. The renderer retains global
visit positions and selected facets through factor levels and
drop = FALSE; it does not manufacture an N = 0
label.
Median lines connect the remaining observed visit medians within each treatment. If the middle visit has no contributing values, the line connects the surrounding observed visits across that empty position. This is a connection between group summaries, not an individual-subject trajectory or an imputed intermediate median.
Rendering and composition
assemble_boxplot()
uses geom_boxplot(stat = "identity") with the five
calculated statistics. It disables the geometry’s own outlier drawing
and adds retained outliers as open circles. Boxes have white fill and
black outlines. Median connections are black lines with larger
white-filled circular markers; outliers use smaller open circles.
Treatment facets use grey headers, black panel borders, bold text,
pale major grid lines, and no minor grid. The Y label is the selected
column name with the selected unit appended when present. The main panel
hides visit labels and X ticks; the aligned N strip supplies the
Analysis Visit axis. Both panels use identical ordered
treatment and visit factors. patchwork::wrap_plots() stacks
them in one column with relative heights c(4, 1).
Fixed and free Y scales change the facet scale configuration, not
these statistics. Fixed assembly starts at Draft; free
assembly starts at Experimental/Draft with a cross-facet
comparison warning. Those initial labels do not establish execution
verification or human approval.
Implementation evidence and limits
The standalone helpers in boxplot_standalone.R
repeat the calculation and visual conventions inside scripts emitted by
compile_boxplot_script().
Changes to statistical or visual rules need corresponding scrutiny in
both implementations.
Inspected tests cover statistics,
assembly,
and compiled
scripts: explicit fixture results, empty groups, non-finite
rejection, row-order invariance, layer values, N-panel alignment, scale
differences, and standalone analytical results. The long-label test
checks PNG creation and dimensions; it does not establish label
legibility through visual inspection. Fixture rows still carry
pending_human_review.
This documentation records inspected implementation and test assertions. No R tests, statistical review, or formal validation were run for this documentation change. The diagram describes data flow and omits rendering dimensions, script setup, execution, and review controls, which have separate documentation.